Heart Rate Variability
Advanced Software Tools for HRV
The Actiheart Software Package includes advanced Heart Rate Variability tools to allow the capture and analysis of HRV data over extended periods. The Actiheart is designed for Heart Rate Variability (HRV) monitoring by provision of high-resolution Inter-beat Interval (IBI) measurements over extended periods up to 14 days.
The Actiheart uses the electrical ECG signal from the heart to measure IBI with 1ms resolution. ECG derived IBI is widely regarded as superior to optical photoplethysmography used in consumer grade devices because ECG provides a clearer waveform and is much less susceptible to disruption from movement artefacts.
The Actiheart has been used in numerous HRV studies; please click or tap here to view HRV publications in our Research Library.
How does it work?
The Actiheart is worn on either two standard ECG pads on the chest or on a belt similar to a Polar wearlink belt. For more information please see the page on wearing the Actiheart.
After the recording has been made, data from the Actiheart is transferred via a direct USB connection to the Actiheart software for analysis.
How are the data displayed?
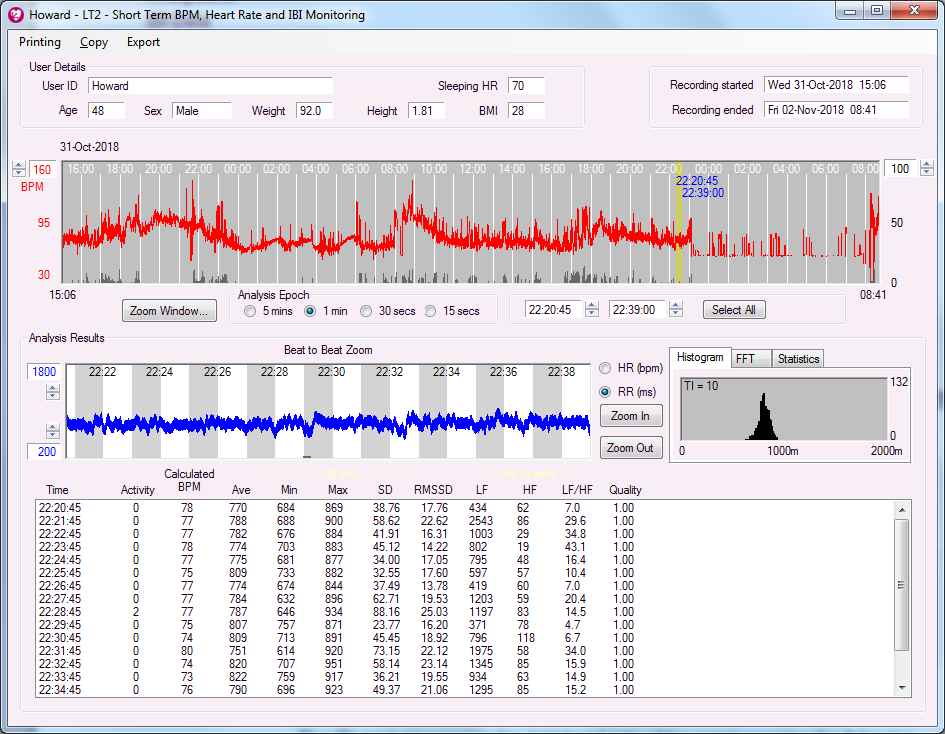
Data can be displayed in a number of different ways and some examples are given below:
Example Heart Rate Variability and IBI analysis window from Actiheart Software

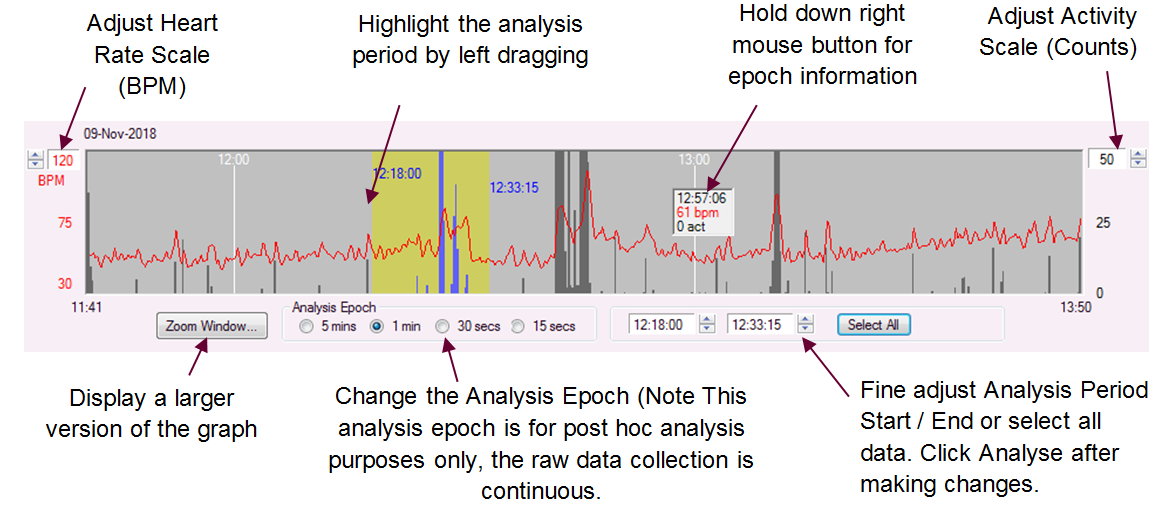
Heart Rate and Activity Graph
The figure below shows some of the key elements of the HR and Activity graph within the IBI analysis window:

Heart Rate Variability Graph
The figure below shows some of the key elements of the HR and Activity graph within the IBI analysis window:

Data can also be exported for use in third party programs such as Matlab, Excel, SAS and SPSS.
HRV Statistics
The statistics calculated by the Actiheart software are based on Published data. Some selected statistics include:
| IBI Ave | The average IBI for the analysis epoch |
| IBI min, IBI max | Minimum and Maximum IBI in the epoch |
| SD | The Standard Deviation of the IBI data |
| LF & HF | The low and high frequency components of the IBI, derived using a FFT |
| Histogram | Occurrence distribution of IBI intervals |
Quick Links
